Grafana Dashboards for Metrics and Log Visualization
In Airlock Microgateway, Grafana dashboards can be deployed either from GitHub release artifacts or via Helm chart. Metrics are obtained using Prometheus and logs are aggregated using Loki in combination with a suitable log agent (e.g., Alloy or similar).
Prerequisites
- Grafana
- For metrics dashboards: Prometheus
- For logs dashboards: Loki
Configuration
Create the PodMonitor and ServiceMonitor
Run the following example to create a new Microgateway Helm release which creates the PodMonitor and ServiceMonitor:
- Deploy Microgateway with
config.gatewayPodMonitor.create=trueandserviceMonitor.create=trueso metrics will be scraped. - Deploy Microgateway with
labels.releasethat matches the<PROMETHEUS-OPERATOR-RELEASE>.
Deploy dashboards manually
Download and import the dashboards
- Go to the Airlock Microgateway GitHub Releases page.
- Select the latest maintenance release matching your Airlock Microgateway version.
- For example, if you are using Airlock Microgateway 5.1, choose the latest 5.1.x release (e.g., 5.1.1). Avoid selecting a newer version as it may not be compatible with your current system setup.
- At the bottom of the release notes, download the file named
dashboards-<version>.zipthat contains the JSON files representing the Grafana dashboards. - Unzip the archive to a local folder.
- The Grafana dashboards can be imported either manually or via the CLI of the corresponding deployment platform (e.g., Azure).
Deploy dashboards via Helm
Verify the Grafana configuration
Verify that Grafana is deployed and running with the sidecar.dashboards.enabled=true flag. This way Grafana automatically adds, updates, and removes Airlock Microgateway dashboards.
Deploy the Microgateway dashboards
In the Airlock Microgateway Operator Helm chart, several preconfigured Grafana dashboard templates are available. Setting the dashboards.create=true enables the deployment of all dashboards.
Run the following example to create a new Microgateway Helm release which creates the Microgateway dashboards as ConfigMap:
- Only one Microgateway Operator per cluster may be configured to provide the Grafana dashboard templates.
- The Helm chart options
dashboards.config.grafana.folderAnnotation.nameanddashboards.config.grafana.dashboardLabel.namemust match the Grafana configuration.
Access the metrics dashboards
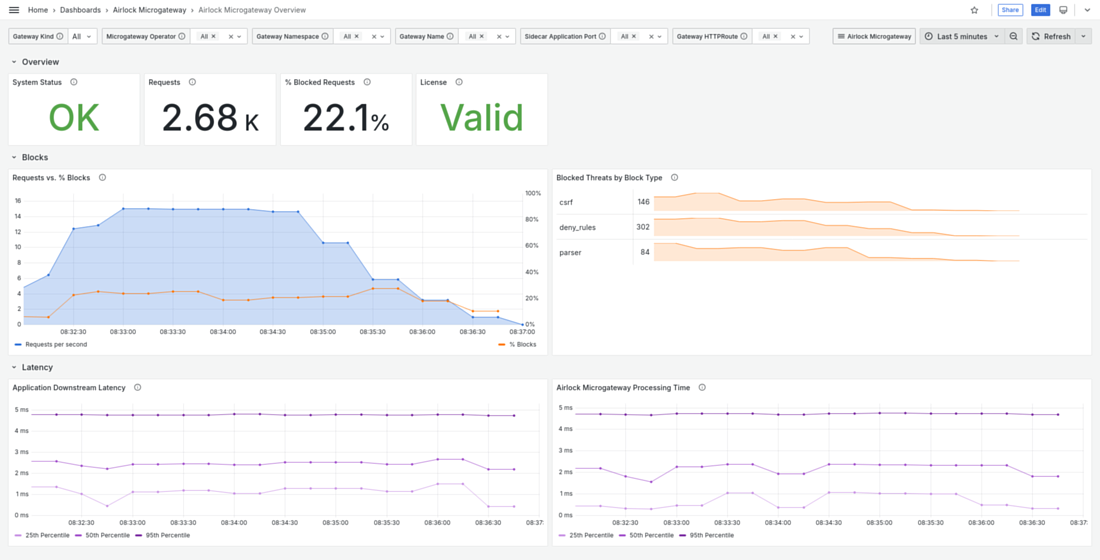
Airlock Microgateway Overview
This dashboard contains statistics and status information on the installed Airlock Microgateway components. It provides an overview of license status, protected pods, processed requests, and latency as perceived by downstream clients.
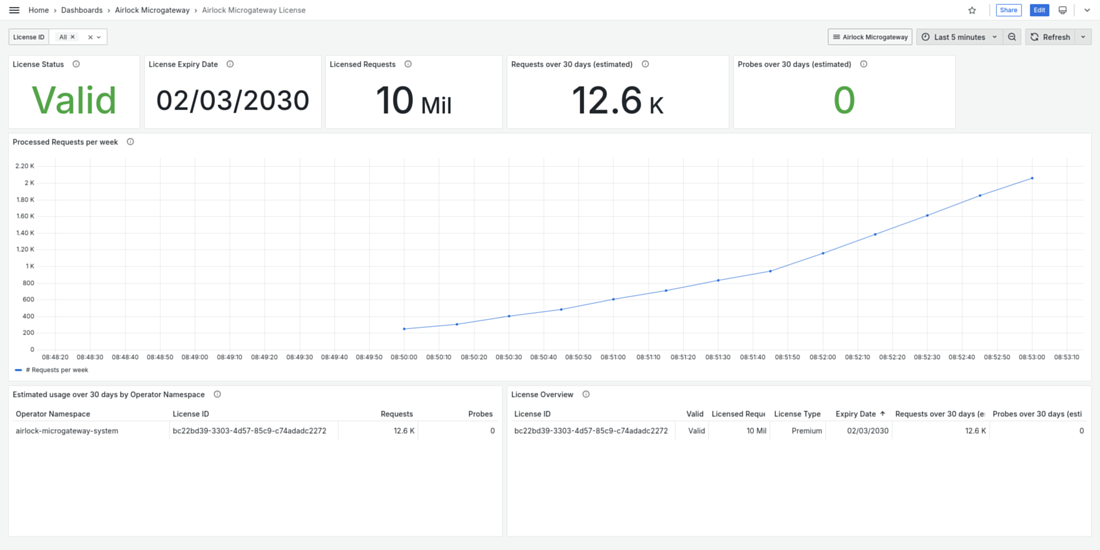
Airlock Microgateway License
The dashboard provides detailed license information and estimated usage over the last 30 days per license ID for licenses assigned to a Microgateway Operator.
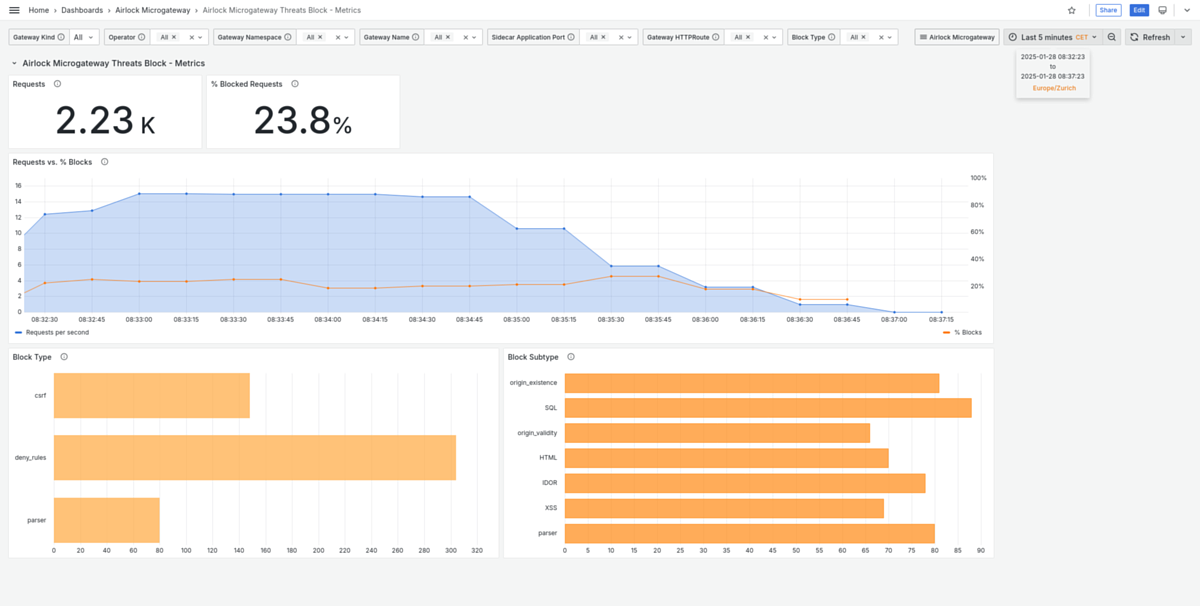
Airlock Microgateway Threats Block
This dashboard shows more detailed statistics on how Airlock Microgateway protects your applications. Processed requests and corresponding block rates can be displayed per Microgateway Operator installation and application namespace, including Block Type and Subtype.
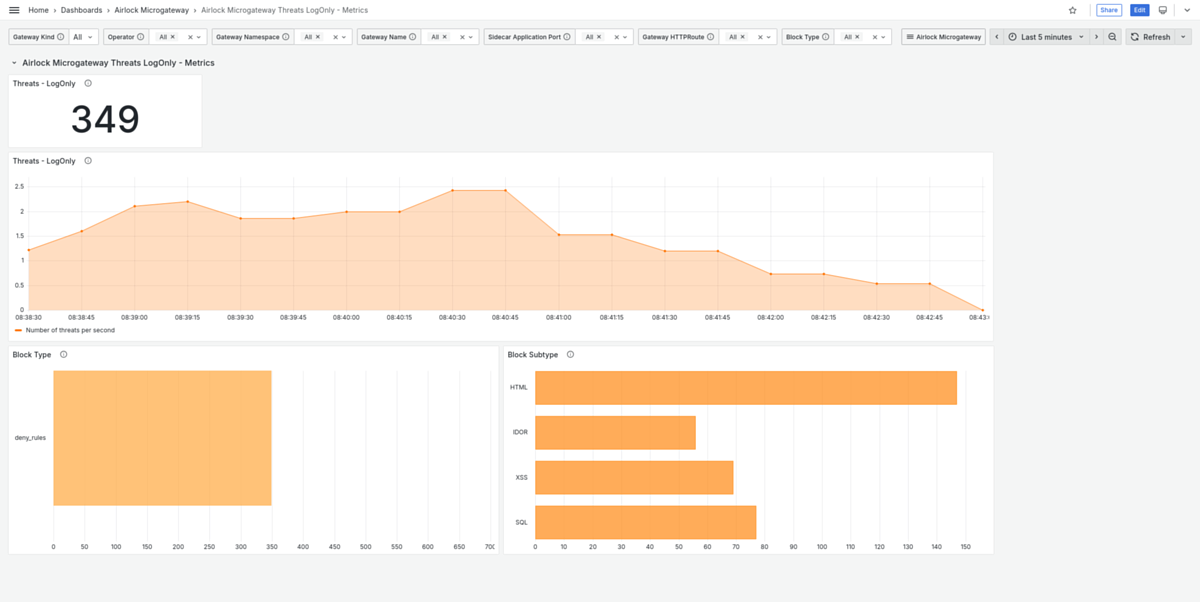
Airlock Microgateway Threats LogOnly
The dashboard presents metrics for threats logged in threatHandlingMode: LogOnly. The temporal distribution and the breakdown by Block Type and Subtype are visualized. See also the related Airlock Microgateway Threat LogOnly Logs dashboard below.
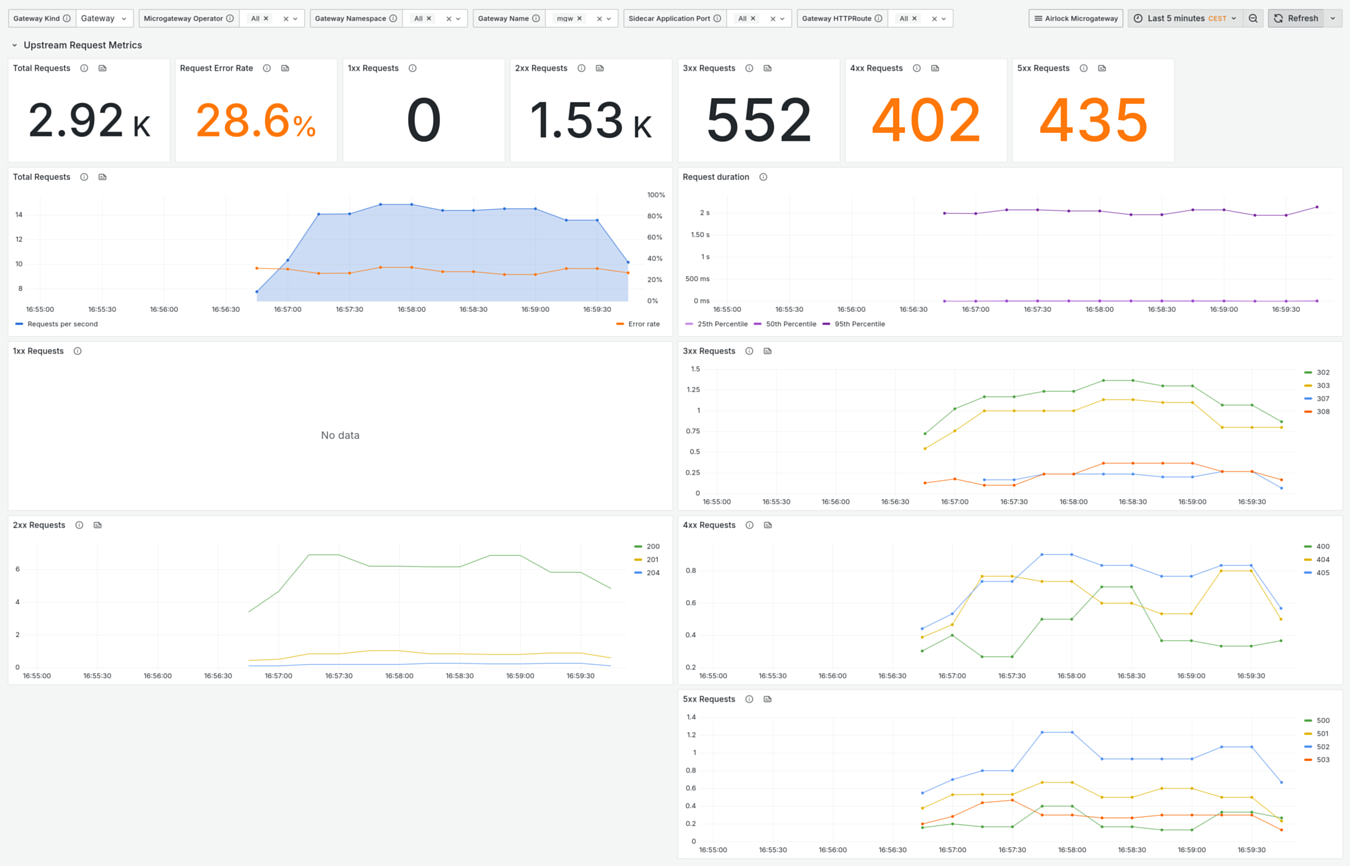
Airlock Microgateway Upstream
This dashboard offers detailed statistics on upstream requests and connections. For upstream requests, metrics include the total number of requests, request duration, and a breakdown by status code. For upstream connections, the dashboard displays, among other things, the total number of connections, histograms of connection length and time to connect, as well as the total volume of data sent and received.
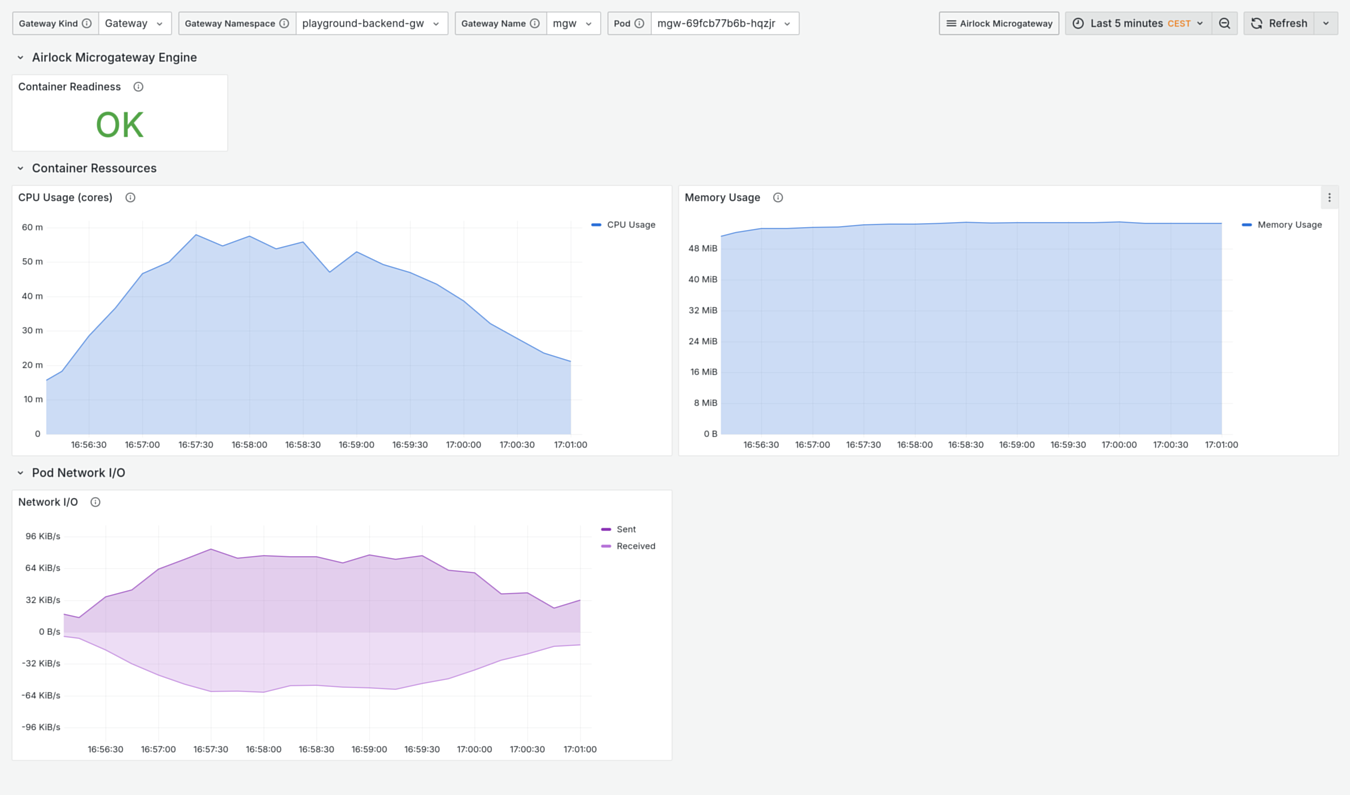
Airlock Microgateway System
The dashboard exposes information about the basic health and resource consumption of the Microgateway Engine.
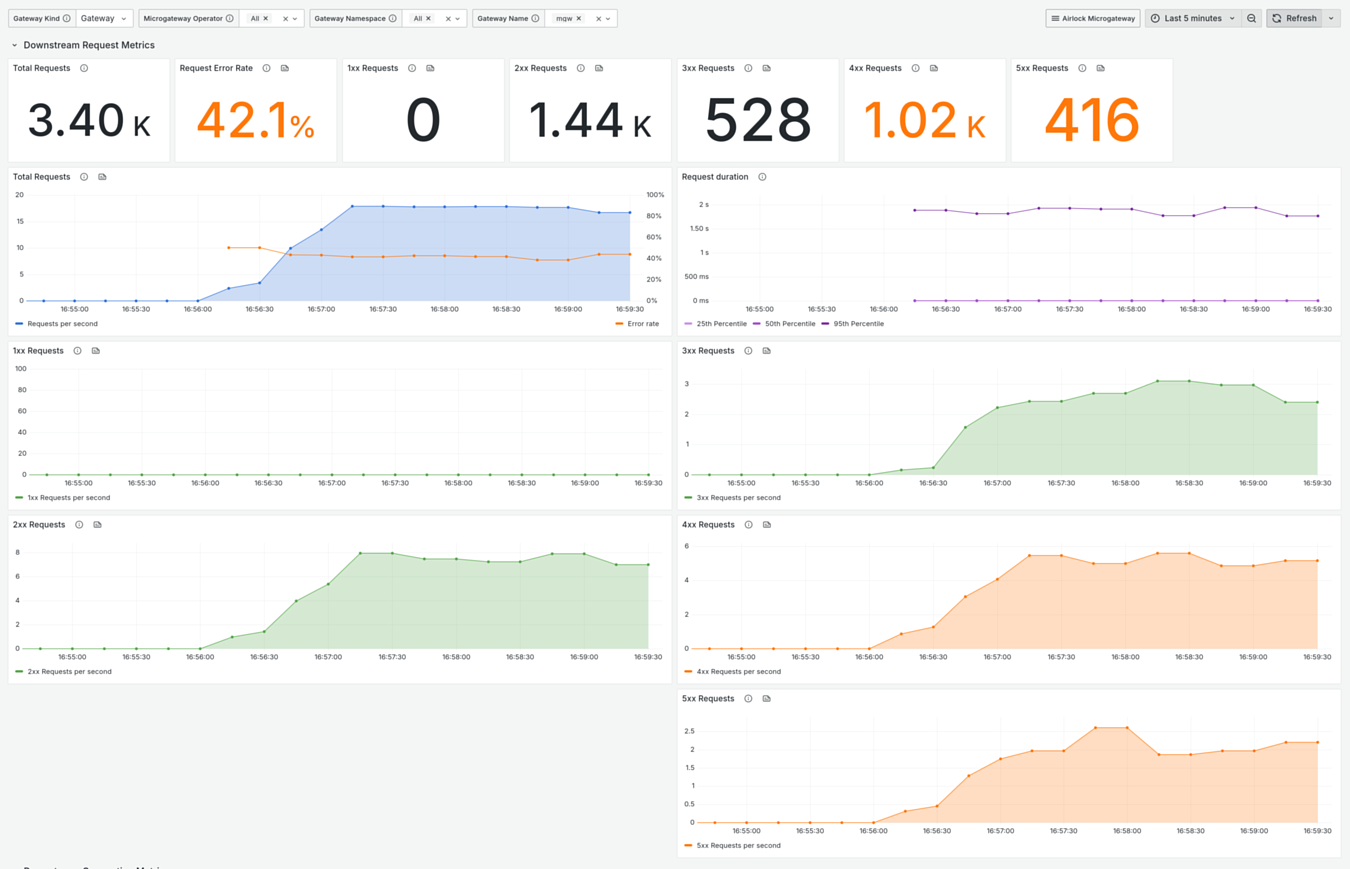
Airlock Microgateway Downstream
This dashboard depicts detailed statistics on client-facing (downstream) requests and connections. For downstream requests, metrics include the total number of requests, request duration, and a breakdown by status code group. For downstream connections, the dashboard contains, among other things, the total number of connections, a histogram of connection length and time to connect, as well as the total volume of data sent and received.
Access the log dashboards
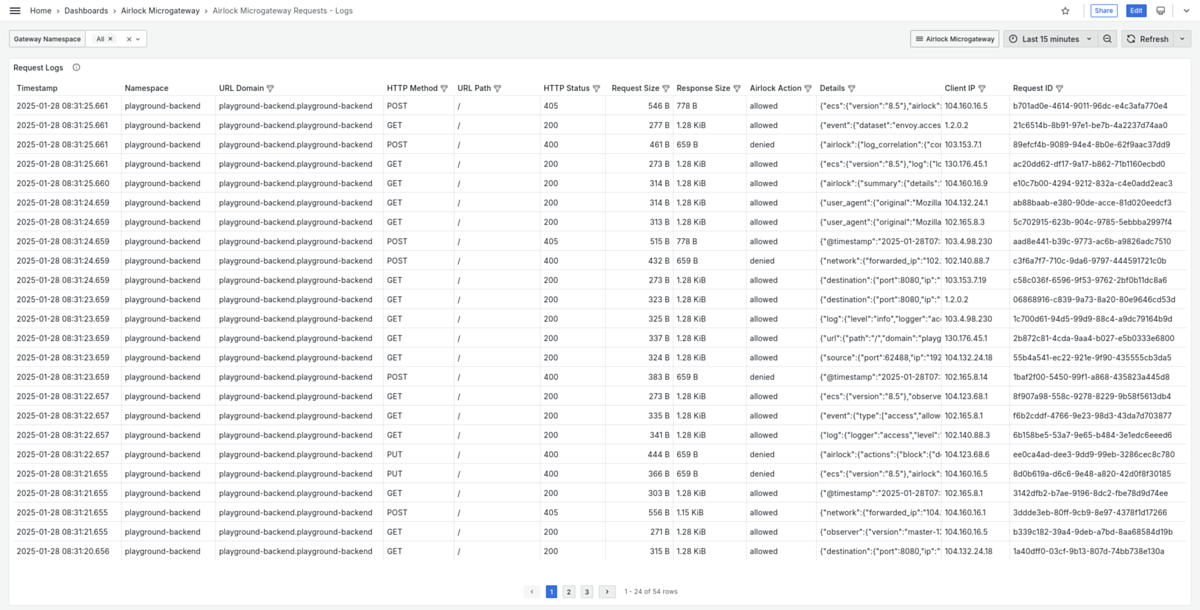
Airlock Microgateway Request
The dashboard lists detailed log information for every request processed by Airlock Microgateway. Filtering on dashboard and table level enables a detailed analysis of the requests.
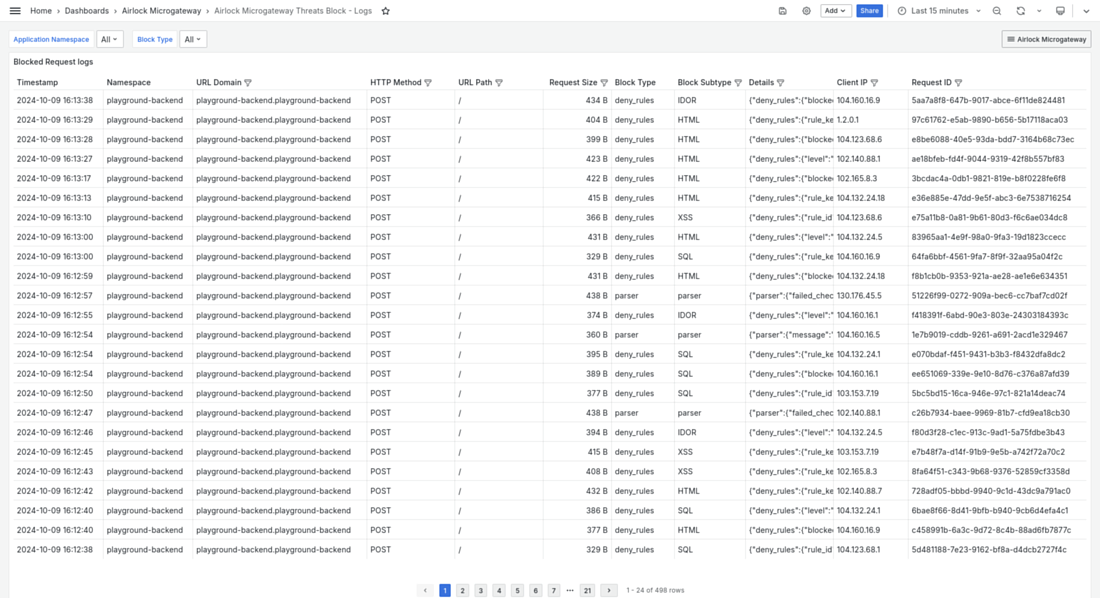
Airlock Microgateway Threats Block
This dashboard displays detailed log data for requests that were blocked due to threats detected in threatHandlingMode: Block. It supports filtering at both the dashboard and table level to enable in-depth analysis of denied requests.
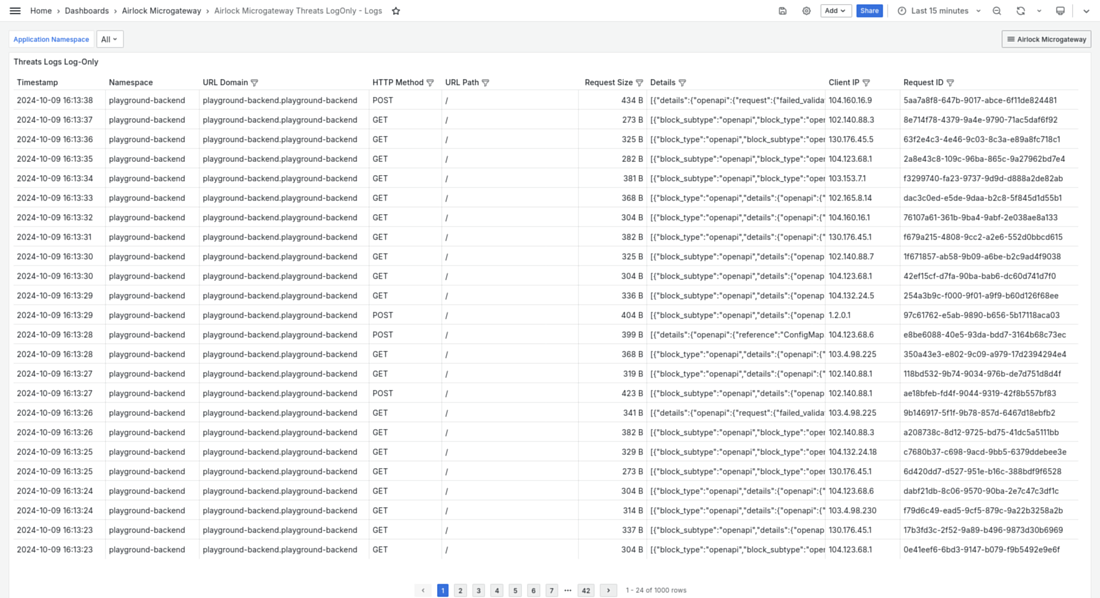
Airlock Microgateway Threat LogOnly
The dashboard provides detailed log data for requests with threats logged in threatHandlingMode: LogOnly. It helps assess the impact of your configuration in production environments, allowing you to identify false positives and to fine-tune configurations without affecting live traffic.
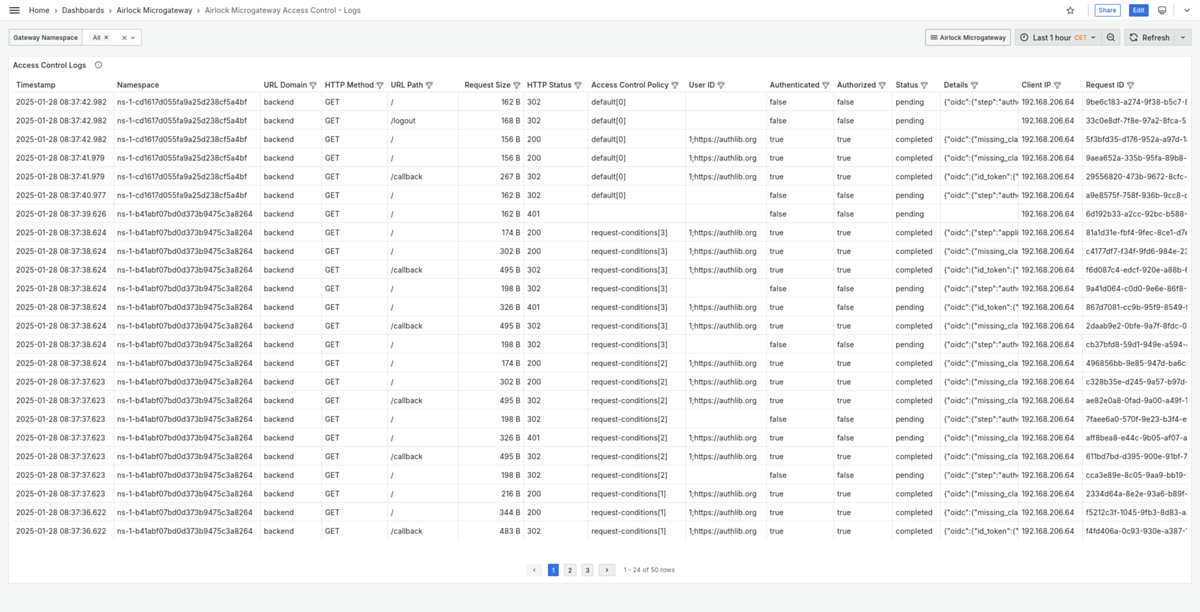
Airlock Microgateway Access Control
This dashboard lists detailed log information for requests with access control details available. Filtering on dashboard and table level enables a detailed analysis of the requests.
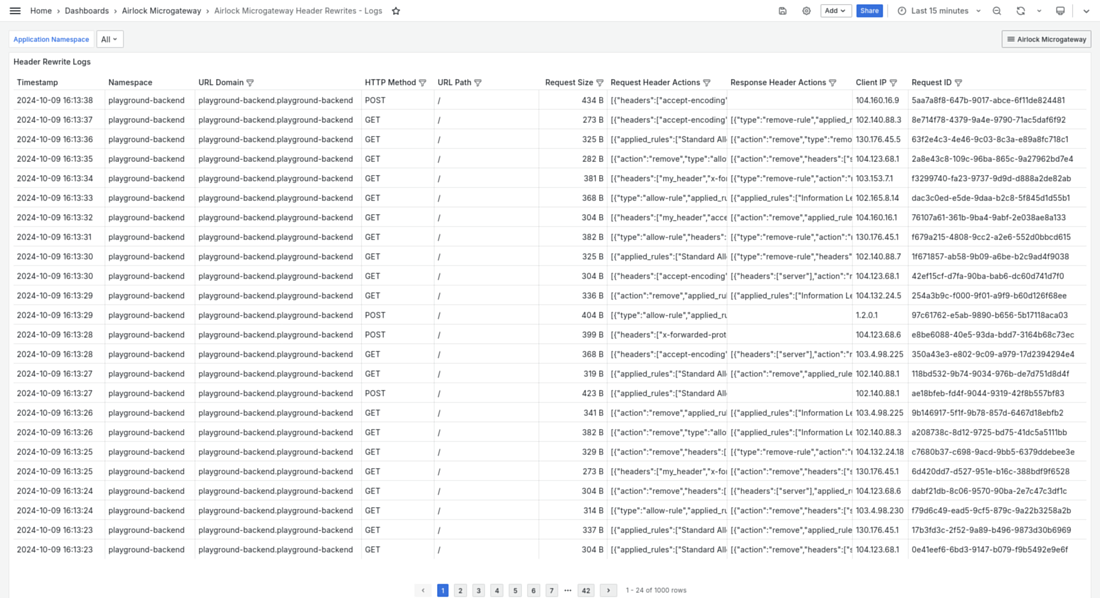
Airlock Microgateway Header Rewrites
The dashboard lists detailed log information for header rewrites to analyze their impact on an application. To enable Header Rewrites Logs, set the operationalMode to Integration. For details, see CR HeaderRewrites reference documentation.