• Airlock Secure Access Hub
  • About this document
  • About Airlock Gateway
  • Release notes
  • Getting started
  • General warnings and recommendations
  • Basic concepts
  • REST API based configuration and administration
  • Configuration Center (GUI)
    • Button – Activate
    • Menu – Dashboard
      • Section – Users logged in
      • Section – System health
      • Section – Proxy statistics
    • Menu – System Setup
    • Menu – Application Firewall
    • Menu – Log & Report
    • Menu – Configuration
    • Menu – Expert Settings
  • Configuration examples and guides
  • Integration of 3rd-party products and applications
  • Operation tasks
  • Reference documentation
  • Expert settings collection
  • Troubleshooting and support
  1. Configuration Center (GUI)
  2. Menu – Dashboard
  3. Section – System health

Section – System health

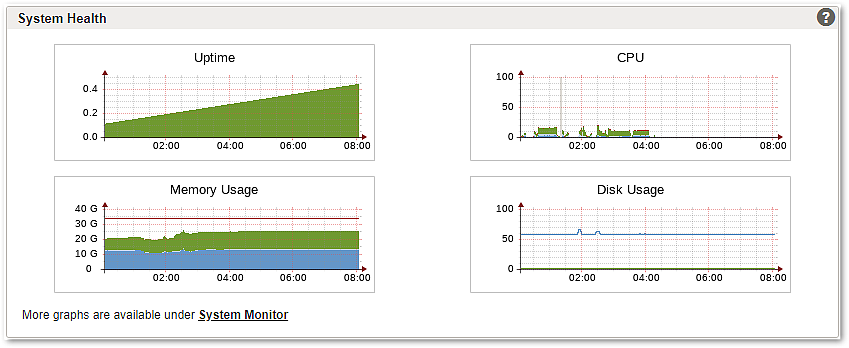
The most important monitoring graphics are shown here:

  • System uptime (with different colors for active, passive and offline times)
  • CPU load
  • Memory usage
  • Disk usage

More monitoring graphics are available under Log & Report - System Monitor.