Menu – Dashboard

Dashboard

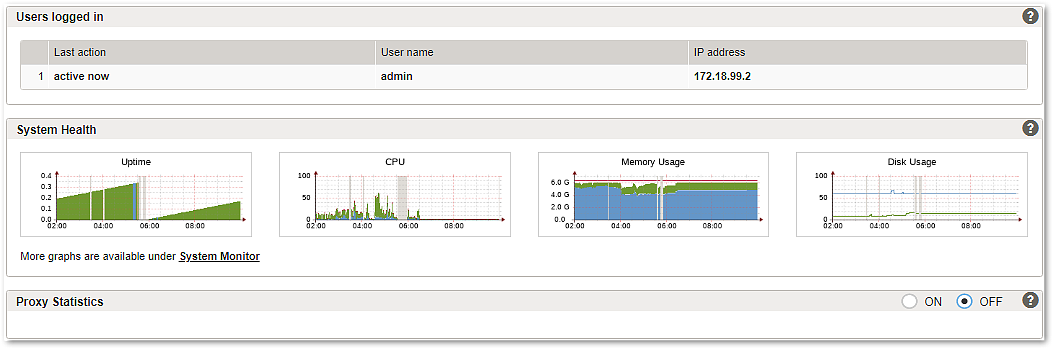
The dashboard is the first page you see after login. It shows the current status of this Airlock Gateway host including the most important system health graphics.

In order to speed up your workflow, the dashboard with proxy and attack statistics will only show up when you switch the radio button to ON.

Log messages after login

Airlock Gateway may show log messages, e.g., in case a license throughput has been exceeded.

For an exceeded throughput, the following warning will appear on top of the dashboard page after login:

Your system exceeded the licensed throughput within the last 24 hours. Please check log messages (log_id: "WR-SG-TIME-200") or the license reporting dashboard, respectively, and contact your sales representative.