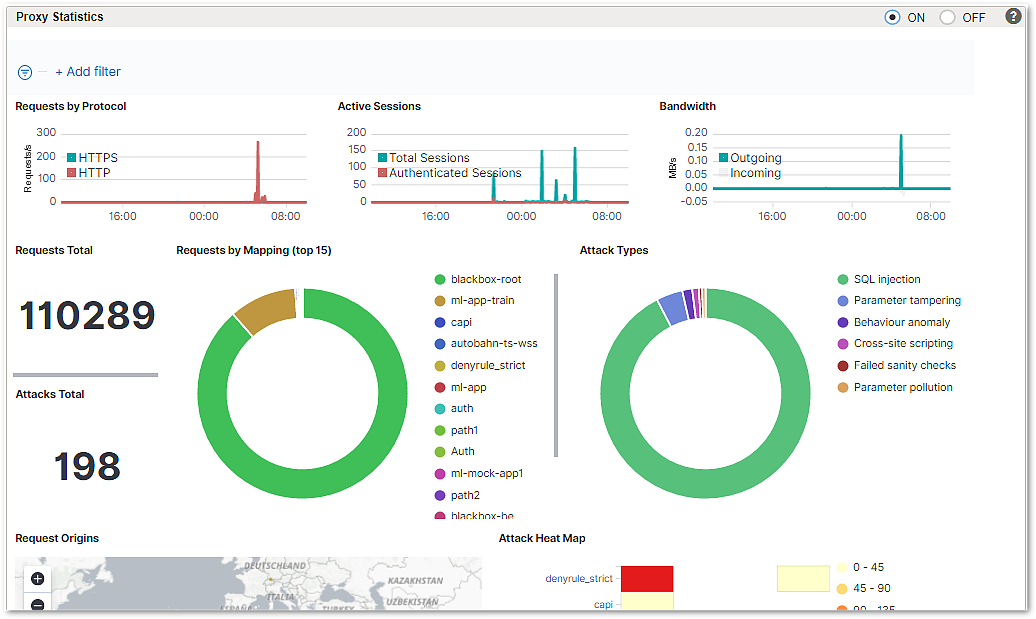
When set to ON, the standard embedded proxy statistics dashboard shows a number of traffic and attack statistics. By default, the dashboard visualizes the last 24 hours.
- Hover over a visualization will let the OPTIONS button appear. Use it to customize the time range etc.
- Hover over the visualization will let the Toggle legend button appear for visualizations with legends or the ability to show legends.
- To reset the statistics, click on the Reset button in the lower right corner.
- To customize the dashboard, click on Open Reporting in the lower left corner. This will also allow adding new dashboard items such as the Dashboard Gateway Throughput (for licensing).
If local reporting is turned off, no embedded dashboard is displayed.